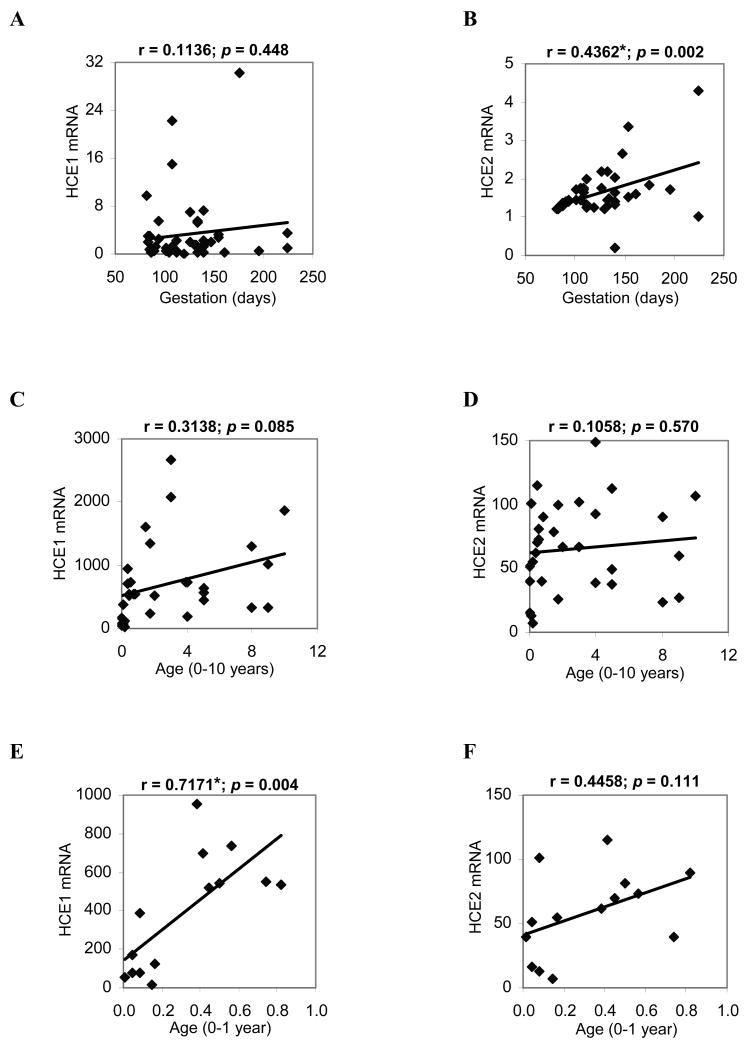
Fig. 2. Age-related expression of HCE1 and HCE2.
The data from Fig. 1 were plotted against age with SPSS version 16. (A) Correlation of HCE1 mRNA with gestation days. (B) Correlation of HCE2 mRNA with gestation days. (C) Correlation of HCE1 mRNA with age in the child group (0-10 years old). (D) Correlation of HCE2 mRNA with age in the child group (0-10 years old). (E) Correlation of HCE1 mRNA with age in the sub-child group (0-1 year old). (F) Correlation of HCE2 mRNA with age in the sub-child group (0-1 year old) *Statistical significance (p < 0.05).

