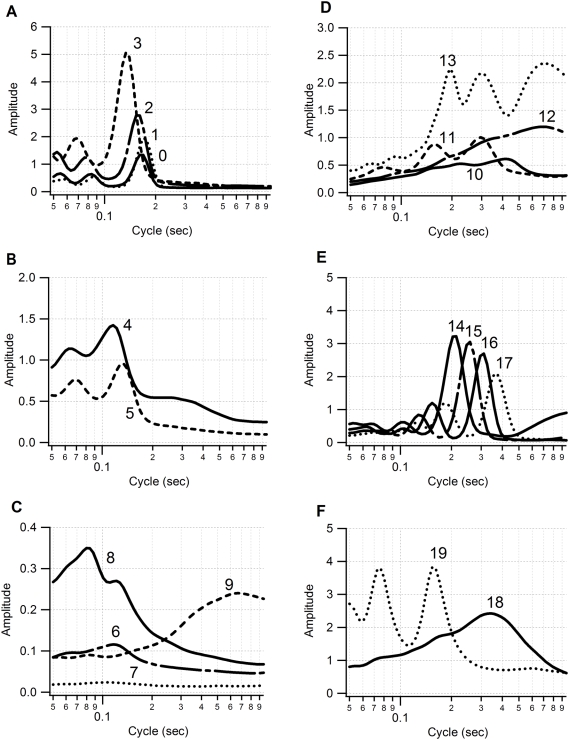
Figure 4. Twenty elements of acceleration ethogram.
The ethogram was constructed from 24 h of surge acceleration data from six shags (3 males and 3 females). The vertical axis represents the amplitude of the acceleration. The horizontal axis represents the cycle length of the acceleration. The ethogram is separated into six figures for ease of visualization.

