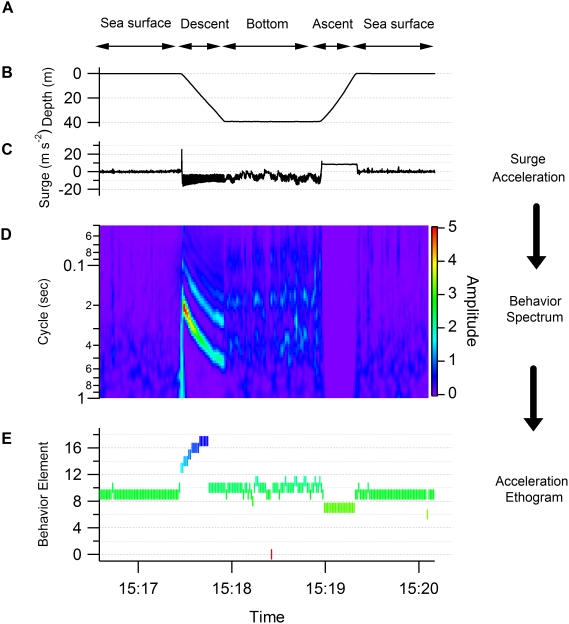
Figure 6. Flowchart of procedure to generate ethogram (data representing dive).
(A) Behavior phases (on the sea surface, dive descent, bottom phase and dive ascent) were determined by data observation. (B) Depth. (C) Surge acceleration. (D) Behavior spectrum. (E) Behavior element as determined by acceleration ethogram. The elements were compared with the results of data observation.

