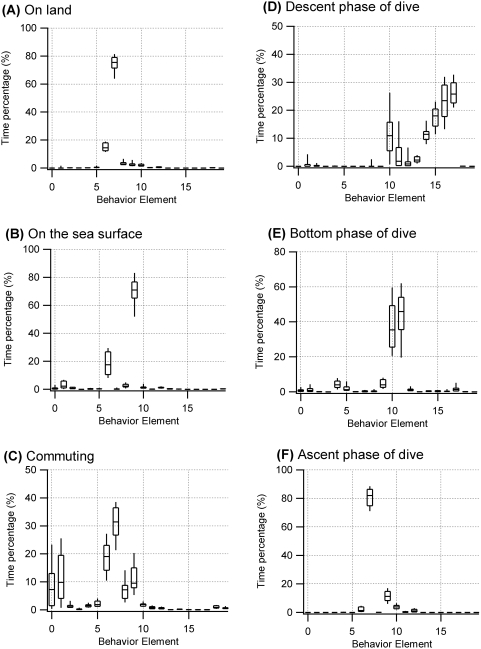
Figure 8. Compositions of behavior elements in different behavior phases.
Box plots for compositions of the behavior elements of the acceleration ethogram in different behavior phases (n = 16). Each behavior phase was defined by a depth profile. Figures represent the compositions of the elements in the behavior of (A) on land, (B) on the sea surface, (C) commuting between colony and foraging site, (D) descending in a dive, (E) bottom phase of a dive, and (F) ascending from a dive. The box plot shows the median (center line), the upper and lower quartiles (edges of the box), and 10% and 90% percentiles (ends of whiskers).

