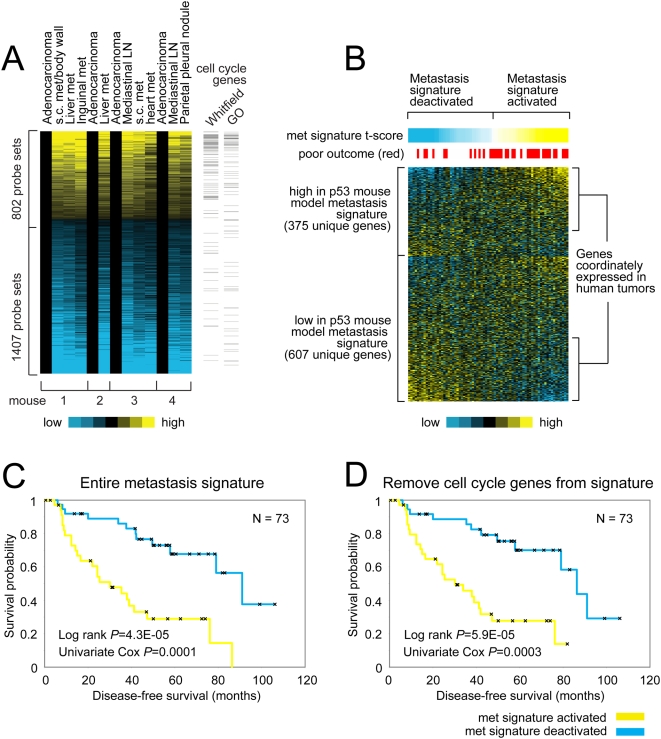
Figure 1. A gene expression signature of spontaneous metastasis in a K-ras/p53 mutant mouse model.
(A) Gene expression profiles of tumor metastases were compared to the corresponding primary tumor to define the metastasis gene signature (P<0.01, paired t-test). Each row of the expression matrix represents a gene and each column represents a profiled sample; relative gene expression (metastasis: primary) is represented using a yellow–blue color scale. Genes defined as cell cycle-related by either the Whitfield signature [16] or by Gene Ontology (GO) are indicated. (B) The expression patterns of the mouse model metastasis signature in a panel of human lung tumors from Bhattacharjee et al. [14]. Tumors showing “activation” of the metastasis signature (as measured by the “met signature t-score”) tend to have high expression of the genes high in the mouse metastases and low expression of the genes low in the mouse metastases. (C) Kaplan-Meier analysis of the human lung tumors comparing the differences in risk between tumors showing activation (yellow line, t-score>0) and tumors showing deactivation (blue line, t-score<0) of the mouse model metastasis signature. Log rank test evaluates whether there are significant differences between the two arms. Univariate Cox test evaluates the association of the met signature t-score with patient outcome, treating the coefficient as a continuous variable. (D) Same as for part C, except that cell cycle-associated genes (as defined by either Whitfield et al or GO) were first removed from the mouse model metastasis signature prior to deriving the met signature t-score.

