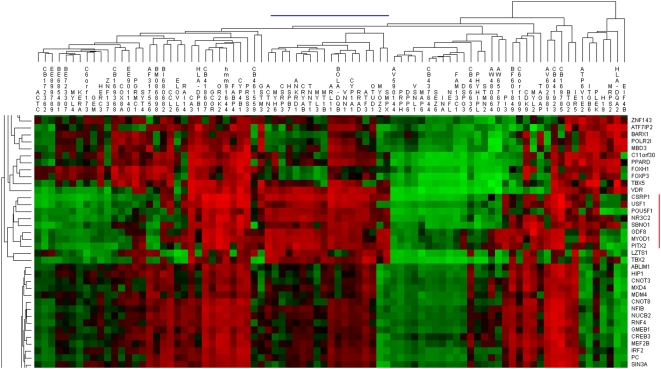
Figure 6. The P×H v W×H “perturbation matrix.”.
We applied Permut Matrix's hierarchical clustering algorithm to both rows (920 regulators) and columns (85 DE genes). A subset of the full matrix including the high phenotypic impact slow twitch module (blue line) and the major high impact transcriptional regulator circuit (red line). The scale is −1.53 (bright green) to +1.53 (bright red), with 0 being black.

