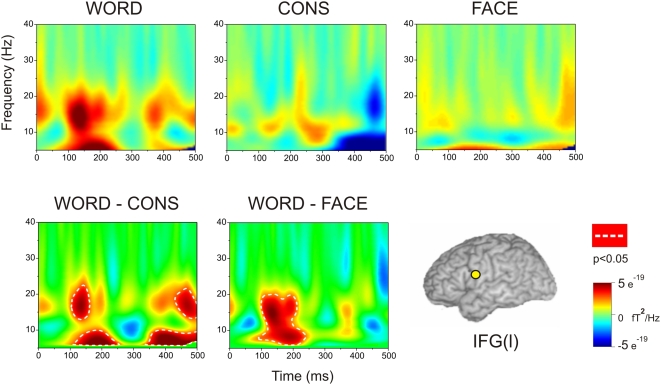
Figure 2. The upper row shows the time-frequency plots for words, consonant strings, and faces for the left IFG ROI.
The lower row shows the differences between the time-frequency plots comparing words with consonants strings and words with faces. The white dotted lines represent regions in the time-frequency plots within which the difference between conditions reached significance at p<0.05, according to the general linear mixed models.

