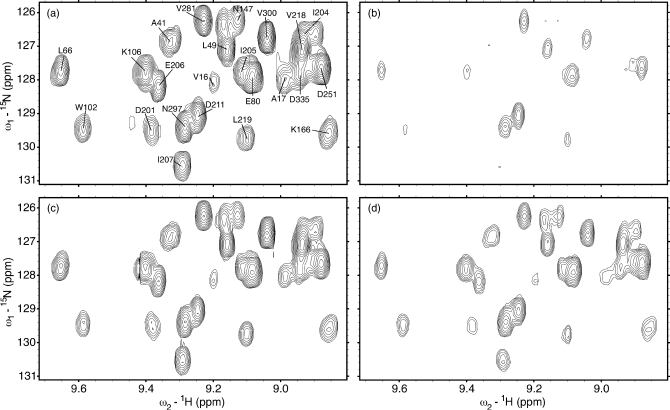
Figure 4.
Evolution of I-type [(a) and (c)] and II-type [(b) and (d)] peaks in a subregion of ηz∕κ TROSY spectra of an E. coli DnaK ATPase domain 2-388 construct at 34.0 °C. Two different relaxation times τ are shown: τ=30 ms [(a) and (b)] and τ=270 ms [(c) and (d)]. Each spectrum was acquired in 1.3 h. All spectral plots were generated in SPARKY (Ref. 29).

