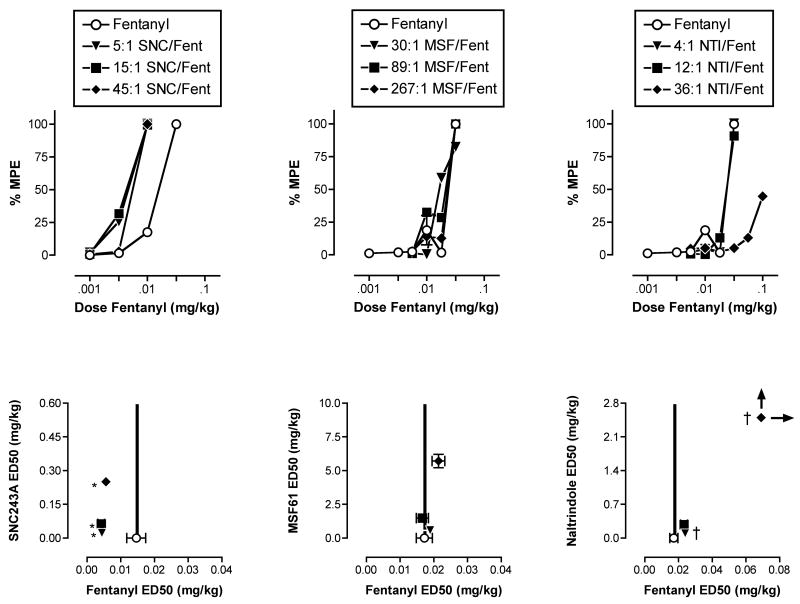
Figure 4.
Effects of fentanyl alone or in combination with different proportions of SNC243A (left panels), MSF61 (center panels) or naltrindole (right panels) in the assay of thermal nociception. Top panels show dose-effect curves for fentanyl and for each mixture. Abscissae (top panels): Dose fentanyl in the mixture in mg/kg (log scale). The corresponding dose of the delta ligand depended on the proportion of the delta ligand in the mixture. Ordinates (top panels): Percent maximum possible effect (%MPE). Bottom panels show isobolograms at the ED50 effect level. Abscissae (bottom panels): ED50 values for fentanyl administered alone or in a mixture (linear scale). Ordinates (bottom panels): ED50 values for the delta ligand administered alone or in a mixture (linear scale). Each point shows mean data for 3 monkeys (left panels) or 4 monkeys (center and right panels). Error bars are not shown in the top panels for clarity. Error bars in the bottom panels show S.E.M.. *Significant superadditivity (see Table 4). † Significant subadditivity (see Table 4).

