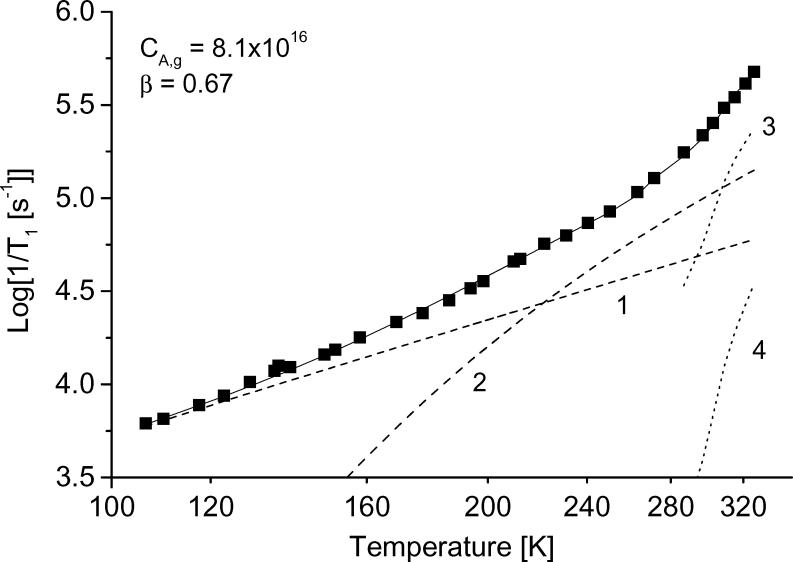
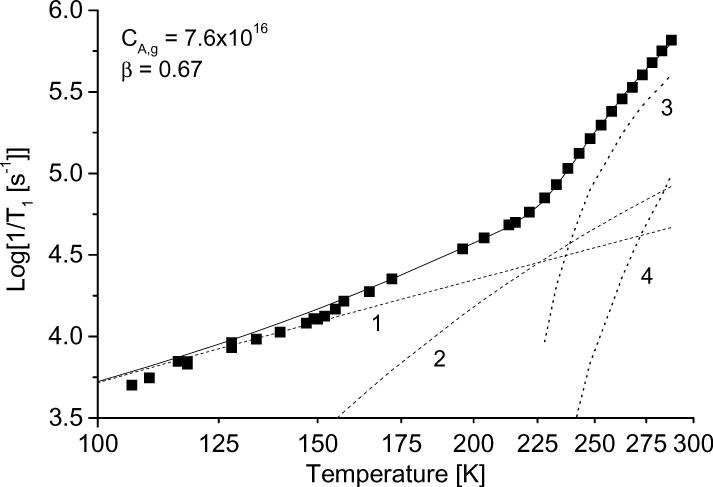
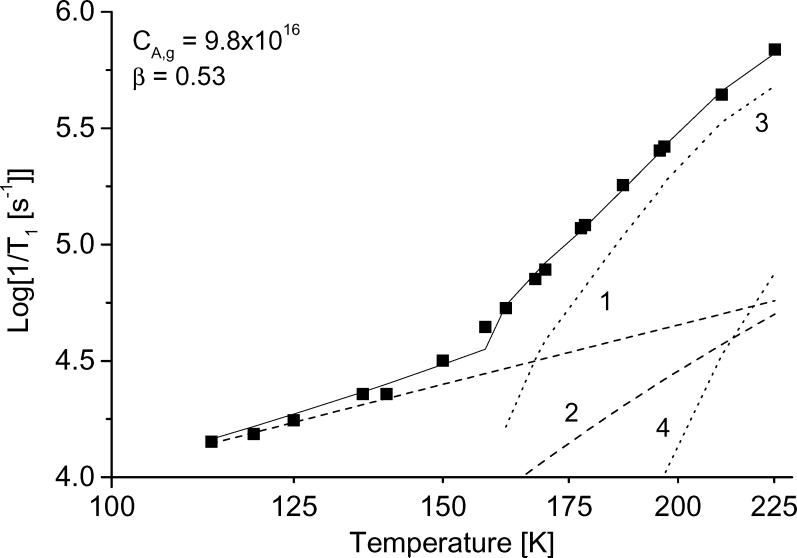
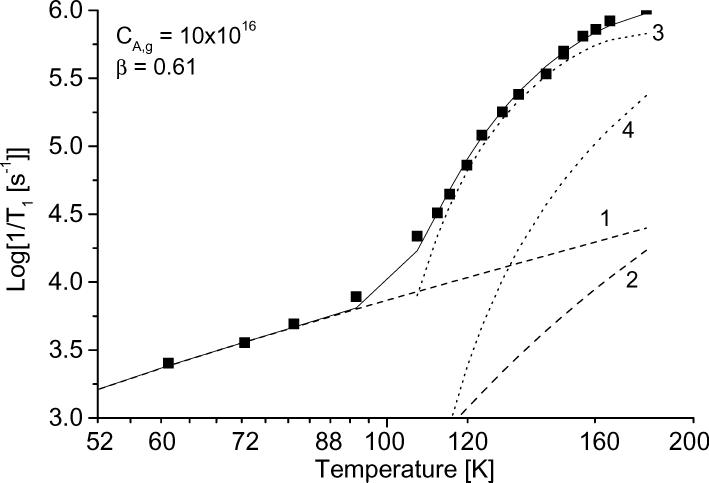
Figure 10.
Simulation of the temperature dependence of 1/T1 for (a) tempone in glycerol, (b) tempone in water:glycerol, (c) tempone in decalin, and (d) tempo in 3-methylpentane. The solid lines are the sum of contributions from the Raman process (dotted line 1), the local mode (dotted line 2), the modulation of A and g anisotropy (dotted line 3) and spin-rotation (dotted line 4). The parameters used to calculate the contributions from each process are listed in Table 1.


