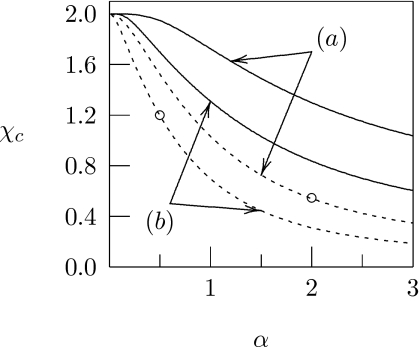
Figure 3.
The critical interaction parameter χc plotted as a function of α. Curves marked (a) and (b) correspond to σ=9 and σ=36, respectively. Solid curves are calculated for Λ=0, dashed curves for Λ=1.5. The two open circles mark the critical interaction parameters for Λ=1.5 at fixed maximal adsorption strength B=18, calculated for α=0.5 and α=2, see discussion in the text.

