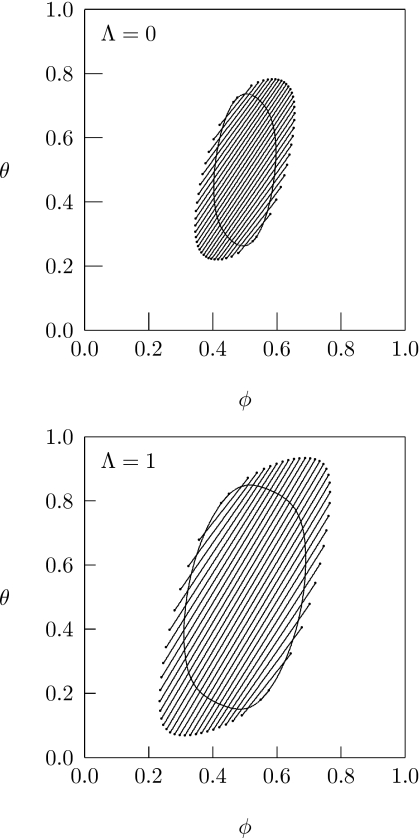
Figure 4.
Phase diagrams for Λ=0 (top) and Λ=1 (bottom). In both cases χ=1.9, α=0.4, and σ=25. (The points χ=1.9 and α=0.4 are marked in the inset of Fig. 2 by an open circle.) The closed loops correspond to the spinodal lines. The endpoints of the tie lines form the binodal region.

