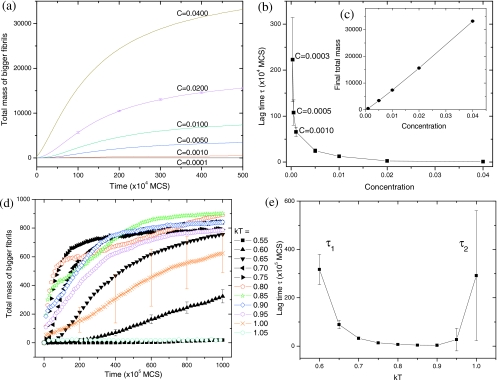
Figure 8.
(a) Time evolution of the total fibril mass (based on all fibrils with size≥10) as a function of the initial peptide concentration. kT=0.8. (b) The corresponding lag time vs concentration. (c) The total mass at t=500×104 MCS vs concentration. (d) Time evolution of the total mass as a function of temperature. C=0.001. (e) The corresponding lag time vs temperature. Each curve is an average of 50 simulation runs. For clarity, only a few error bars are shown for (a) and (d).

