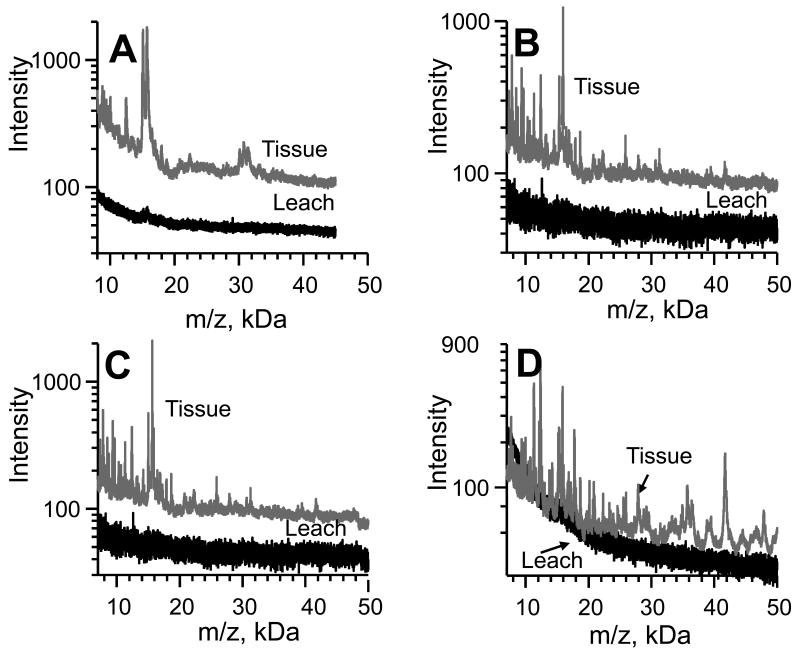
Figure 2.
Key points in the development of the enhanced method. A. High m/z signals are not obtained with spray coating 14 μm mouse kidney slices. The top spectrum is the average from the entire kidney section. A spectrum from analyte that leached from the kidney with the matrix is also shown. B. Mouse kidney sections (14 μm) placed upon a drop of SA/EtOH yield a better signal. C. Triton X-100 (SA/EtOH/T) in the bottom layer further improves the signal from mouse kidney sections. D. Replacement of SA/ACN with SA/EtOH as the 2nd top layer.

