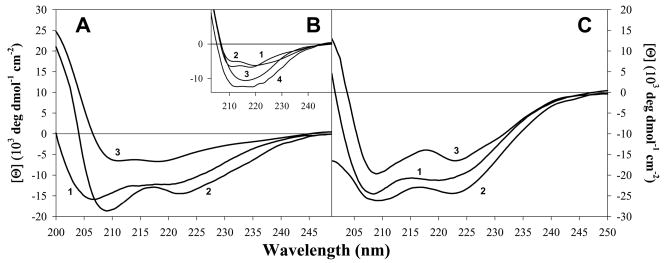
Figure 4.
Far-UV CD difference spectra for AnI and AnII binding to their respective S100 protein binding partners, in the presence of 5 mM calcium, determined using equation 6. Panel A shows the far-UV CD spectrum for AnI in 60 % TFE (curve 1; shown for comparison), the difference spectra for AnI bound to S100A11 (curve 2) and for AnI bound to S100A6 wild type (curve 3). Panel B shows the difference spectra for AnI bound to: S100A6 wild type (curve 1; shown for comparison), S100A6-Y84S (curve 2), S100A6-Y73F (curve 3) and S100A6-Y73F-Y84S (curve 4). Panel C shows the far-UV CD spectrum for AnII in the presence of 60 % TFE (curve 1; shown for comparison), the far-UV CD difference spectra for AnII bound to S100A10 (curve 2) and S100A11 (curve 3).

