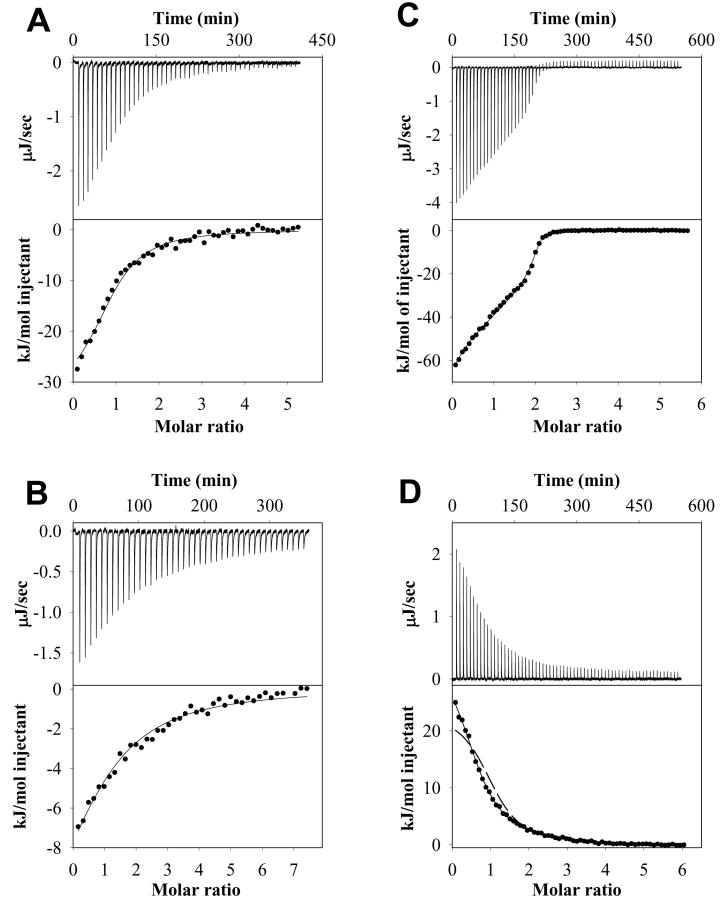
Figure 5.
Examples of ITC experiments for AnI or AnII binding to their specific S100 protein binding partners. Shown for each example are the heat effects (μJ/sec) as a function of time, the cumulative heat effects (kJ/mol and represented by symbols) as a function of the molar ratio of peptide to protein, and the fits to the experimental data (solid lines) for: AnI binding to S100A11 at 35 °C (Panel A; data fitted to equation 7), AnI binding to S100A6 at 35 °C (Panel B; data fitted to equation 7), AnII binding to S100A10 at 15 °C (Panel C; data fitted to equation 9) and AnII binding to S100A11 at 6 °C (Panel D; data fitted to equation 9). For comparison, the dashed line in Panel D shows the experimental binding data fitted to a model describing identical binding sites (equation 7).

