Figure 3.

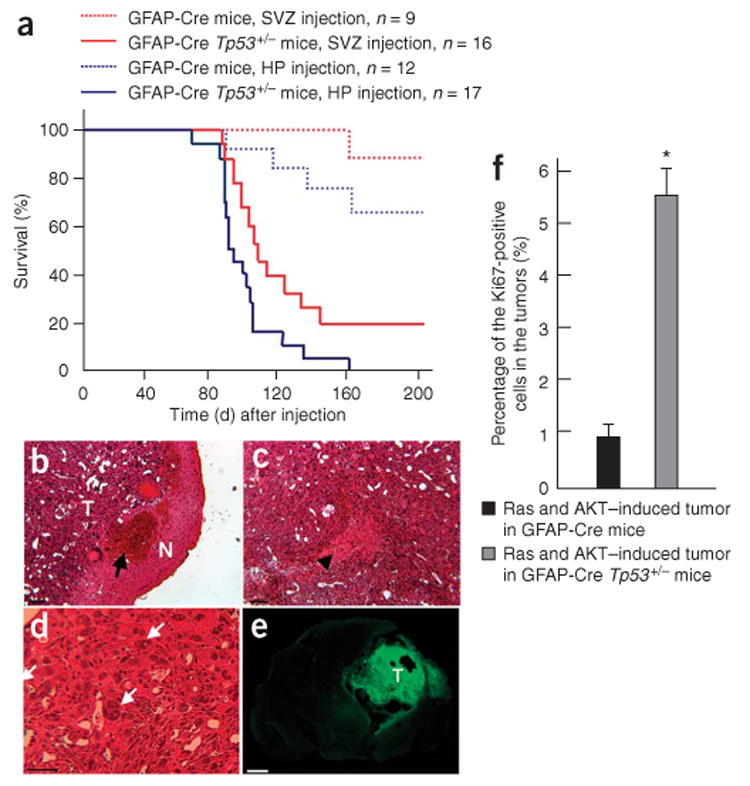
Effects of p53 loss on tumor formation induced by combined activation of H-Ras and AKT. (a) A Kaplan-Meier curve showing glioma-free survival. GFAP-Cre or GFAP-Cre Tp53+/− mice were injected with Tomo H-RasV12 LVs and Tomo AKT LVs into hippocampus or subventricular zone. (b–d) H&E staining of the tumor induced by combined activation of H-Ras and AKT in the right hippocampus in a GFAP-Cre Tp53+/− mouse. T and N in b indicate the tumor area and the normal tissue area, respectively. Black arrow in b indicates intratumoral hemorrhage. Black arrowhead in c indicates the area of necrosis. White arrows in d indicate giant cell formation in the tumor. Scale bars, 50 μm. (e) Confocal micrograph showing GFP+ cells throughout the tumor area. T indicates tumor area. Scale bar, 1.5 mm. (f) A graph showing the proportion of the cycling cells in tumors. Tumor tissues originated from the right hippocampus found in GFAP-Cre or GFAP-Cre Tp53+/− mice were stained with Ki67-specific antibody, at least 700 cells in three different locations were examined in each tumor, and the number of cells positive for Ki67 was calculated. *P < 0.05; data represent means ± s.d.
