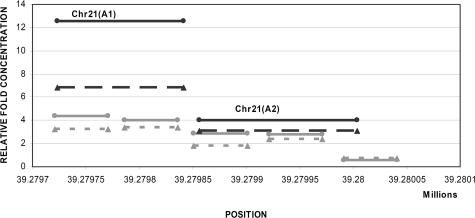
Figure 2.
Comparison of the DNA methylation enrichment of CHR21(A) from oligonucleotide arrays and real-time quantitative PCR using whole blood, first trimester and third trimester placental DNA samples. The y axis indicates the relative fold enrichment of placenta when compared with whole blood DNA sample and the x axis indicates the chromosomal position in bp. The gray lines represent the oligonucleotides covering the specific region on chromosome 21 whereas the black lines represent the PCR products [CHR21(A1) and CHR21(A2)] Biomarkers, Genomics, Proteomics, and Gene Regulation when real-time quantitative PCR was applied. The dotted lines represent the results obtained from a first trimester placenta whereas the solid lines represent the results obtained from a third trimester placenta.

