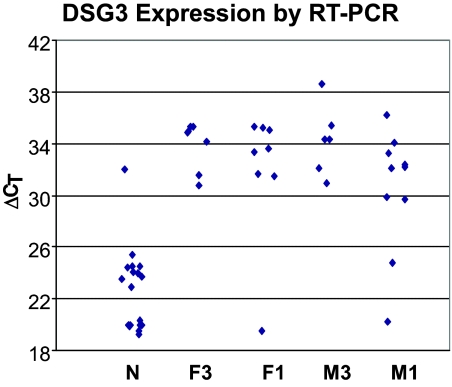
Figure 1.
DSG3 is highly overexpressed in SQCC compared with the adjacent non-neoplastic tissue by qRT-PCR. Data points represent DSG3 expression in bulk samples from SQCC and adjacent non-neoplastic samples (N), and in LCM samples from female stage III (F3), female stage I (F1), male stage III (M3), and male stage I (M1) patients. Vertical axis represents β-actin normalized expression by qRT-PCR calculated as ΔCT = 40 − (CT−DSG3 − CT−β-actin). Each cycle difference in the y axis represents ∼twofold change. On the average, DSG3 is overexpressed in SQCC by >30-fold.

