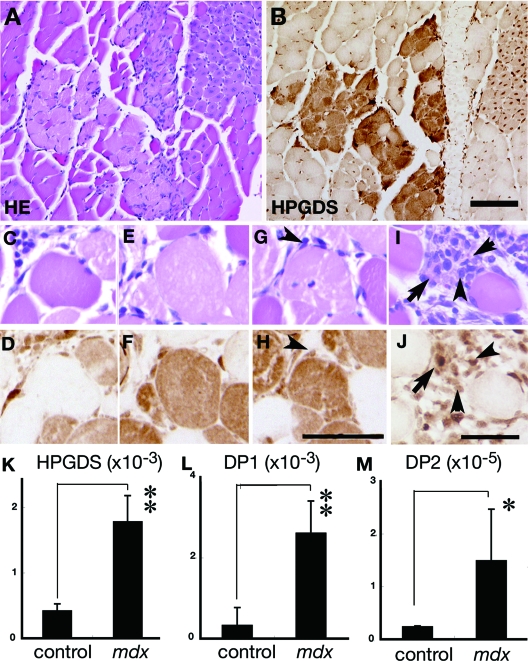
Figure 4.
HPGDS expression in the necrotic muscle from an mdx mouse. A, C, E, G, I: H&E staining. B, D, F, H, J: HPGDS immunocytochemistry. Scale bar = 50 μm. Arrowheads indicate HPGDS-positive macrophages; and arrows, HPGDS-positive regenerating muscle fibers. K–M: Quantitative RT-PCR for HPGDS, DP1, and DP2 mRNAs. n = 4. Data are the mean ± SE. *P < 0.05, **P < 0.01.

