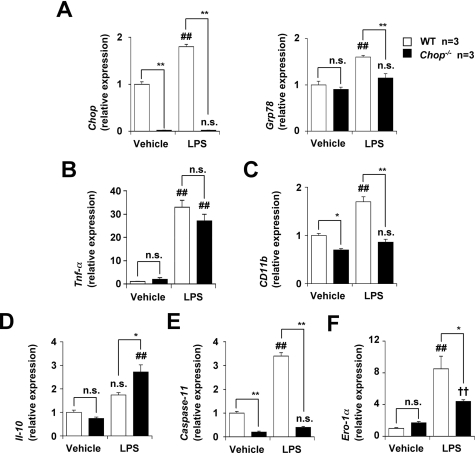
Figure 5.
The mRNA expression of various genes in peritoneal macrophages. Peritoneal macrophages were prepared from CHOP-null mice (Chop−/−) and WT mice and incubated with 10 ng/ml of LPS for 12 hours (3 hours for the Tnf-α). Relative mRNA expression of each gene in colonic tissues was monitored and expressed as described in the legend of Figure 2A. A:Chop, Grp78. B: Tnf-α. C:CD11b, D: IL-10. E:Caspase-11. F:Ero-1α. Values are mean ± SEM (n = 3). ** or ##P < 0.01; * or #P < 0.05; n.s., not significant.

