Figure 1.
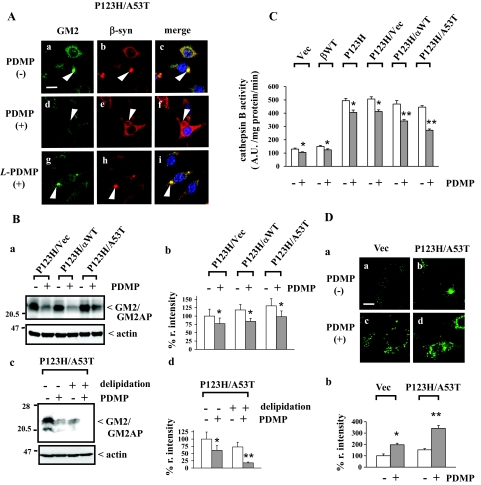
Compromised lysosomal activities in PDMP-treated syn-overexpressing cells. P123H β-syn-overexpressing cells were transfected with vector, wild-type α-syn, or A53T α-syn. Cells were then treated with or without PDMP (25 μmol/L) for 24 hours, followed by various evaluations. In some experiments, vector-transfected cells, wild-type β-syn-overexpressing cells, and P123H β-syn-overexpressing cells were also analyzed. A: Double immunofluorescence/LSCM of GM2 and β-syn for P123H β-syn-overexpressing cells transfected with A53T α-syn.. All figures are shown at the same magnification. Arrowheads indicate the inclusion formation. Note that the anti-GM2 immunoreactivity is remarkably diminished by treatment with PDMP (d--f) but not with L-PDMP (g--i). Similar results were observed in three independent experiments. B: Immunoblot analysis of the anti-GM2 immunoreactivities. In a, cell extracts (10 μg) were analyzed by immunoblot using anti-GM2. Equivalent protein loading in each lane was confirmed by immunoblotting with anti-actin antibody. In b, the band intensities corresponding to GM2/GM2AP were quantified and corrected with those of actin. The data are shown as a percentage of the relative intensity (% r. intensity) obtained from P123H β-syn-overexpressing cells transfected with vector and are expressed as the mean value ± SD (n = 4). *P < 0.05 versus PDMP-untreated cells. In c, cell extracts of P123H β-syn-overexpressing cells transfected with A53T α-syn were delipidated as described in Materials and Methods. In d, the band intensities corresponding to GM2/GM2AP were quantified and corrected with the intensities of actin bands. The data are shown as % r. intensity of the value obtained from PDMP-untreated/nondelipidated cells and are expressed as the mean value ± SD (n = 4). *P < 0.05, **P < 0.01 versus PDMP-untreated cells. C: Measurement of lysosomal activities. Cell extracts (10 μg) were incubated at 37°C with fluorogenic cathepsin B substrate to measure the activity of cathepsin B. Released fluorescence (excitation, 380 nm; emission, 460 nm) was monitored every 5 minutes up to 60 minutes. Fluorogenic intensity of each time point was plotted and the slope was calculated. The data are expressed as arbitrary units (A.U.) and shown as the mean value ± SD (n = 4). *P < 0.05, **P < 0.01 versus PDMP-untreated cells. D: LysoSensor staining to evaluate lysosomal activities. In a, P123H β-syn-overexpressing cells transfected with A53T α-syn and vector-transfected cells treated without (a, b) or with (c, d) PDMP were stained with LysoSensor Green DND-153. In b, the intensities of LysoSensor green fluorescence corresponding to a were measured by software FV10-ASW 1.7 (Olympus, Tokyo, Japan). The data are shown as % r. intensity of the fluorescence of vector-transfected cells without PDMP treatment and are expressed as the mean value ± SD (n = 4). *P < 0.05, **P < 0.01 versus PDMP-untreated cells. Scale bars: 20 μm (A); 10 μm (D).

