Figure 8.
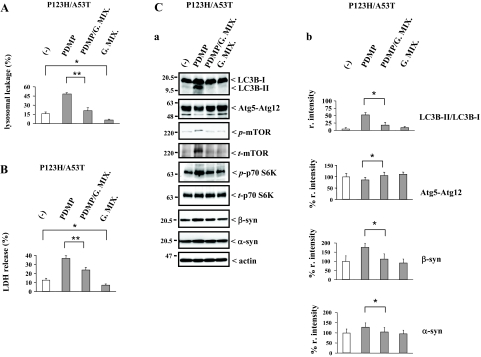
PDMP-induced lysosomal pathology is ameliorated by addition of gangliosides. P123H β-syn-overexpressing cells were transfected with A53T α-syn. Cells were then treated with or without PDMP (25 μmol/L) in the presence of either ganglioside mixtures (G. Mix.) (50 μg/ml) or vehicle (0.1% methanol) for 24 hours, followed by various analyses. A: Quantification of Lucifer Yellow redistribution. The number of Lucifer Yellow-positive cells in their cytosols was calculated as a percentage of the total number of cells. Data are shown as means ± SD (n = 4). *P < 0.05, **P < 0.01 versus G. Mix.-untreated cells. B: Quantification of LDH release. LDH release was calculated as a percentage of the total cellular LDH. Data are shown as means ± SD (n = 4). *P < 0.05, **P < 0.01 versus G. Mix.-untreated cells. C: Immunoblot analysis of the autophagy regulatory molecules and syn proteins. a: The soluble fractions of cell extracts (10 μg) were analyzed using immunoblot for LC3B, Atg5-Atg12, p-mTOR, t-mTOR, p-p70 S6 kinase, t-p70 S6 kinase, β-syn, α-syn, and actin. In b, the intensities of the bands of these molecules were quantified and corrected with that of actin. For LC3B, the ratio of LC3B-II relative to LC3B-I was calculated and is expressed as the mean value ± SD (n = 4). For Atg5-Atg12, β-syn, and α-syn, the data are shown as % r. intensity of the value obtained from the cells without PDMP treatment and are expressed as the mean value ± SD (n = 4). *P < 0.05 versus G. Mix.-untreated cells.

