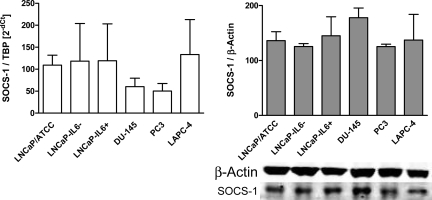
Figure 1.
SOCS-1 mRNA and protein levels in prostate cancer cell lines. Cells were grown under standard conditions and SOCS-1 expression levels were measured using quantitative real-time PCR and Western blot, respectively. SOCS-1 mRNA levels were normalized to levels of the housekeeping gene encoding TATA-box binding protein and those of SOCS-1 protein to the value of β-actin. Data represent mean value ± SE; n = 4 independent experiments carried out in triplicate.

