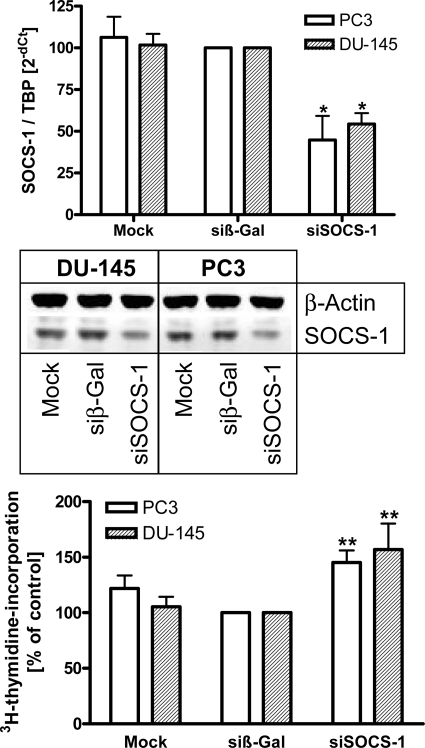
Figure 6.
Inhibition of SOCS-1 expression causes a moderate growth advantage. Cells (DU-145 and PC3) were seeded onto six- and 96-well plates for quantitative real-time PCR, Western blot or proliferation assays, respectively. 72 hours after mock or siRNA transfection (final concentration 100 nmol/L), SOCS-1 levels (top, middle) and proliferation status (bottom) were measured; n = 3 to 5 independent experiments carried out in triplicate. *P < 0.05, **P < 0.01.

