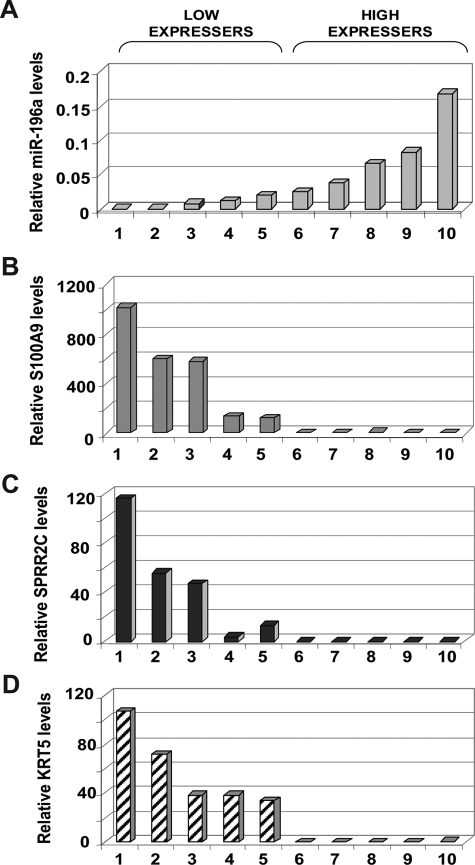
Figure 4.
Inverse correlation of miR-196a levels with mRNA levels of S100A2, SPRR2C, and KRT5, three genes characteristically down-regulated in EA. A: Relative miR-196a levels in advanced EAs from 10 patients as measured by real-time qPCR. The relative levels showed considerable variation among EA, so the EA specimens were arbitrarily grouped into low- (samples 1 to 5) and high-expressing (6 to 10) tumors. The relative mRNA levels of S100A2 (B), SPRR2C (C), and KRT5 (D) in the same samples were inversely correlated with the relative levels of miR-196a. Each data point represents mean expression levels of duplicates from a single experiment.

