
Figure 6. Quantification of relative expression levels for Hh network components in P0 wild type and orJ retinas by sqRT-PCR.
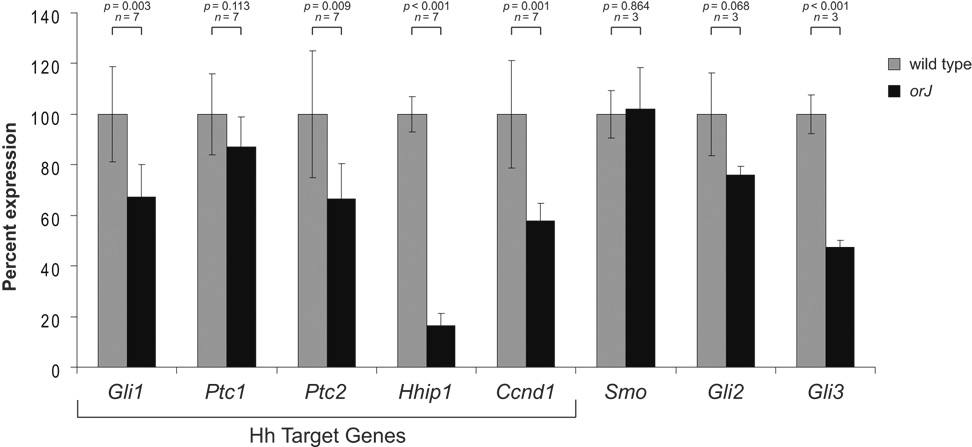
The mean wild type expression level for each gene was set at 100 percent with the orJ level presented as a percent of wild type expression. Hh target genes are those genes whose expression levels are generally considered as indicators of pathway activity‥ Bars represent the mean ± standard deviation. n refers to the number of independently isolated RNA samples. p values calculated by Student’s unpaired t-test or Welch’s two sample t-test, as appropriate (based on results of an F test of variances). See Supplemental Figure S1 for sqRT-PCR optimization curves.