
Figure 7. Shh expression at P0.
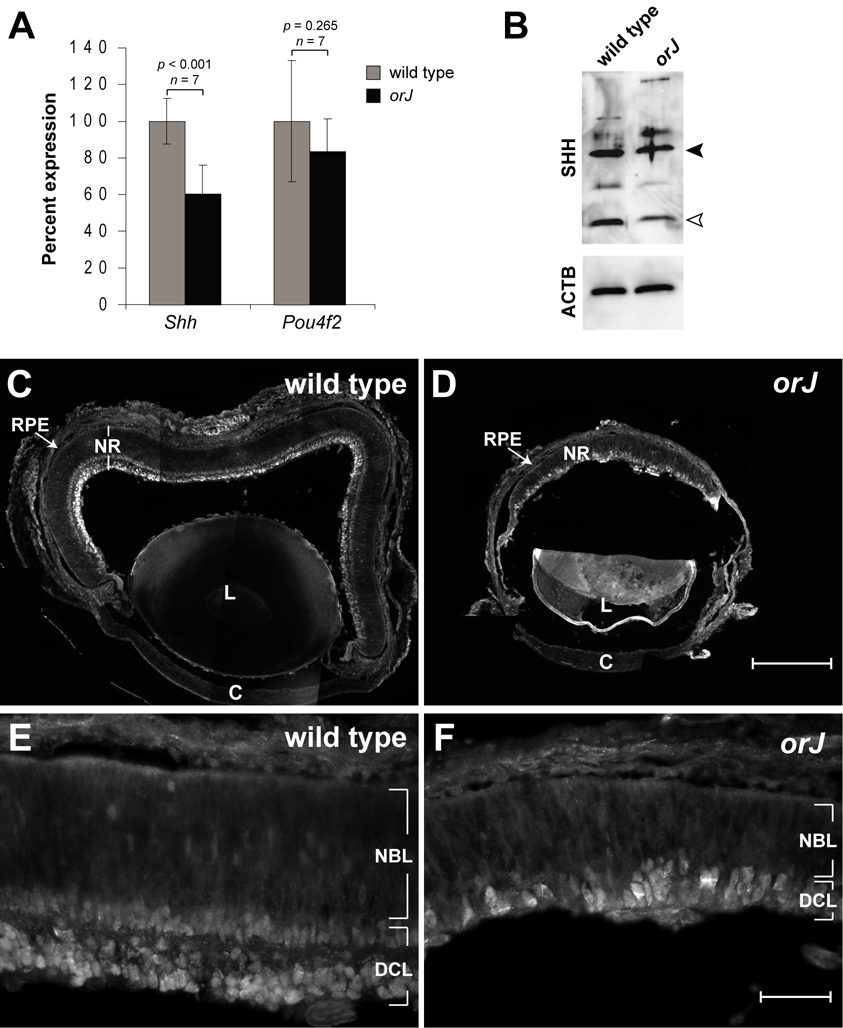
(A) Relative expression levels of Shh and Pou4f2 mRNAs in wild type and orJ retinas as determined by sqRT-PCR. Bars represent the mean ± standard deviation. n and p values are defined as described in Fig. 6. (B) Relative expression of SHH protein in wild type and orJ retinal protein lysates. Closed arrowhead points to band consistent with size of full-length SHH and open arrowhead points to band consistent with size of the N-terminal fragment of SHH. Blot was reprobed to show ACTB expression as an independent measure for protein loading. (C–F) Spatial expression of SHH protein in wild type and orJ eyes. Scale bars: 200 µm for (C, D); 50 µm for (E, F). See Supplemental Figure S2 for anti-SHH immunoreactivity controls.