
Figure 2.
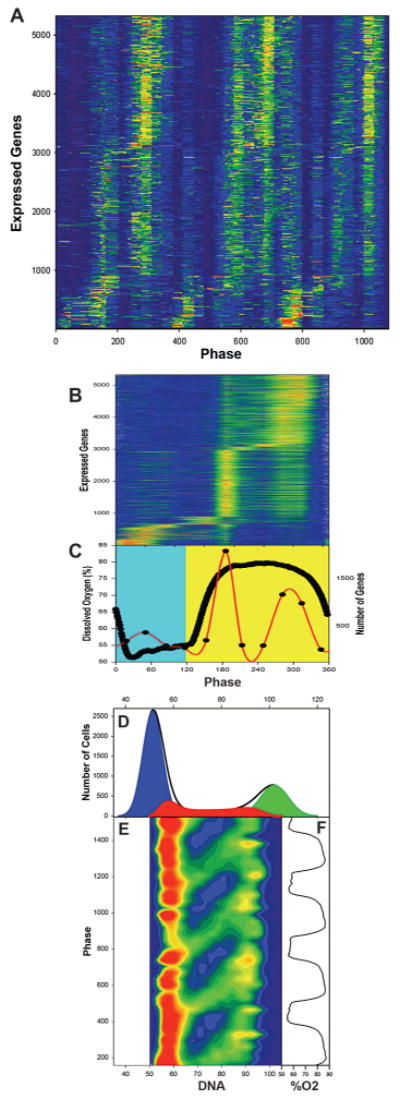
Genome-wide oscillations gate S phase. (A) Color contour (intensity) maps of the expression levels of the 5329 expressed genes are shown for 32 RNA samples through three cycles of the dissolved oxygen (DO) oscillation. To get a measure of the experiment to experiment reproducibility, the first ten samples were taken from a different experiment from those in samples 11–32. (Orange) High levels of expression; (blue) low levels of expression. Genes were scored as present based on the Affymetrix default settings and were included in the analysis if they were scored as present in each of the three cycles for at least 1 of the 32 samples. Values shown here were scaled by dividing the average expression level for each gene into each of the time-series samples for that gene. Transcripts were ordered according to their phase of maximum expression in the average of three replicates. Samples are identified according to their phase in the cycle (0–360°/cycle). (B) Consensus expression levels from three cycles of the TRAC oscillation. Sample phases are shown in reference to the DO curve (thick black line, C). Color scale: (orange-red) >1.6; (dark blue) <0.8. (C) Summary of the results for the time of maximum expression (red line) for the transcripts of A. The reductive phase is taken to be the period of minimal oxygen consumption (maximum DO, yellow background) in the interval between the minimum DO levels, and the respiratory phase is shown against a blue background. (D) Low cytometric analysis of S-phase gating in the reductive phase of the cycle. (E) An example of one-dimensional frequency histogram of DNA content. DNA content of the population for 39 samples taken at 4-minute intervals through four cycles of the TRAC have been stacked with respect to the time in the DO oscillation at which they were sampled as indicated in F. In the resulting two-dimensional color map, with red indicating more cells and blue representing fewer cells, the track of cells through S phase appears as a series of green bands moving left to right and upward on the diagonal. (Red) 350 cells; (light green) 200 cells; (dark blue) 0. (Reprinted, with permission, from Klevecz et al. 2004 [©Elsevier].)