
Figure 3.
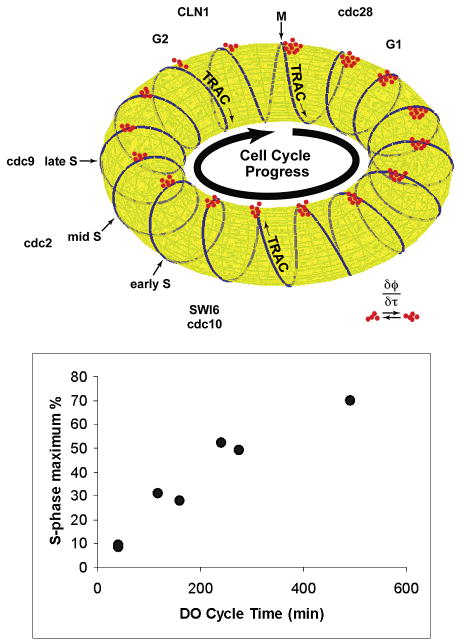
TRAC cycle and S-phase fraction. (Top) Sketch of the relationship between the TRAC and the cell cycle. Red clusters indicate that greater numbers of cells (red dots) signal to the population from G1 phase compared with S and G2. As the length of the DO oscillation increases, it is expected that the number of turns of the TRAC around the torus would decrease, thereby increasing the fraction of cells entering S phase in any turn of the TRAC. In the limit, when there are just two turns of the TRAC per cell cycle, the S-phase fraction should be maximal. Defining the relationship of the track to the cell cycle should give the information necessary to design culture conditions in which continuous cell cycle synchrony is maintained. (Bottom) Flow cytometric determined maximum S phase as a function of the length of the DO cycle.