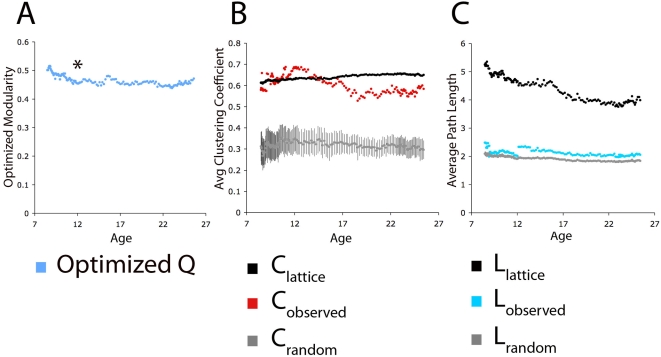
Figure 3. Modularity and ‘small world’ topology remain constant over age.
In this figure a modularity optimization algorithm is applied, and average clustering coefficients and average path lengths are calculated for each average matrix of the ‘sliding boxcar’ across age (see Materials and Methods). A threshold of r≥0.1 was applied to the matrices before calculations were performed and denotes connected versus non-connected region pairs (see Materials and Methods). (A) From childhood through adulthood modularity (Q) remains high and constant. This result is not dependent on a specific threshold as shown in Figure S1. (Note: All age graphs to the right the asterisk show 100% graph connectedness, meaning there is a path between every node in the network. Graphs to the left of the asterisk are 78% graph connected, on average. For details see Materials and Methods and Figure S1). (B) Relative to equivalent lattice and random networks, average clustering coefficients remain high across age and do not appear to be different between children and adults. (C) Relative to equivalent lattice and random networks, average path lengths remain low across age and do not appear to be different between children and adults. High clustering coefficients and short path lengths suggest a ‘small world’ organization that does not change across the age range studied here. 95% confidence intervals are also plotted for clustering coefficients and path lengths for the generated random graphs.

