
Figure 2.
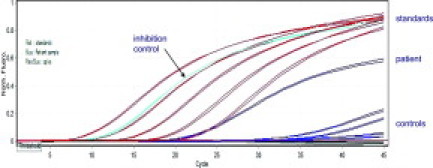
Illustrative fluorescence traces from an MRD assay. The traces for the standards, which range from 2 × 10⁻³ to 2 × 10⁻⁷, the test sample, for which the measured MRD level was 4 × 10⁻⁷, the control for inhibition, which should and does come up at 2 × 10⁻⁴, and the various other controls are shown. This example has been deliberately chosen to show the sensitivity and specificity of the assay, as the test band shared clonal identity with the leukemic rearrangement, having the same electrophoretic mobility and sequence. One intact leukemic rearrangement in 10 μg of good quality DNA was apparently being detected.