
Figure 4.
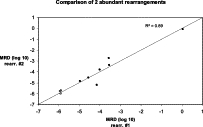
Marrow samples with more than one abundant IGH rearrangement: comparison of levels of two such rearrangements in a single marrow sample. The data show actual MRD levels (closed circles) and the less than MRD level for samples in which MRD was not detected (open circles), corresponding to one intact rearrangement in 10 μg of DNA. The line shows, for reference, the 1:1 correspondence between the two measurements.