
Figure 6.
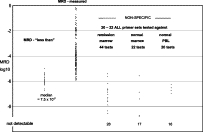
Analysis of limit of detection and nonspecificity. The less than refers to 67 measurements in which MRD was not detected and indicates the hypothetical MRD value that would correspond to one intact marker rearrangement in the 10-μg DNA sample. The second column indicates the measured MRD values in 180 measurements in which MRD was detected and quantified. The last three columns indicate the nonspecific MRD levels when 20 to 22 primer sets were tested against samples of remission marrow from a different patient, normal marrow, or normal peripheral blood mononuclear cells, from 25, 10, and 19 individuals, respectively.