
Figure 7.
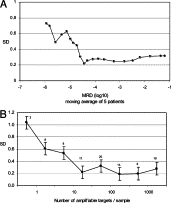
The SD determined from two or more independent measurements of MRD on the same sample. The mean SD results are plotted either in terms of a moving average of five MRD measurements (A) or in terms of the number of intact molecules of the marker IGH rearrangement in the sample of 10 μg of DNA (B). The number shown above each data point in B indicates the number of samples contributing to that data point, and the error bars indicate ±1 SE.