
Figure 2.
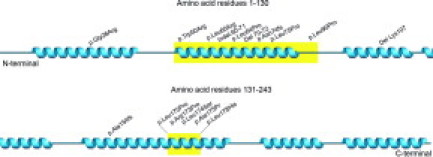
Distribution of ApoAI mutations with regard to the proteins secondary structure. The hot spot regions spanning residues 50 to 93 and 170 to 178 are marked in yellow and the twisted blue areas represent the α-helices. The picture of the secondary structure of ApoAI was obtained from the database Jpred at the European Bioinformatics Institute and modified.