Figure 1.
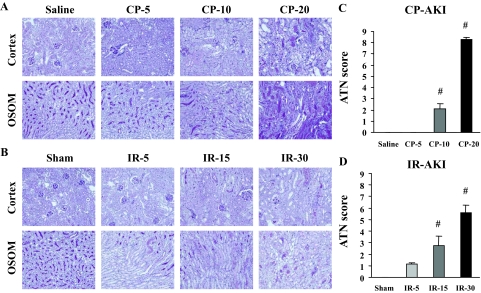
Histological evaluation of CP- and IR-induced AKI. CP with different dose injections (0, 5, 10, 20 mg/kg) and different ischemia times (0, 5, 15, 30 minutes) were conducted. Representative histology in CP (A)- and IR (B)-induced AKI are shown. Stepwise increases of total ATN score in CP (C)- and IR (D)-induced AKI along with CP dose and ischemia time were found. [n = 5 ∼ 10 per group, #P < 0.05 versus saline (CP) or sham (IR) group]. OSOM, outer stripe of outer medulla. Original magnifications, ×200.

