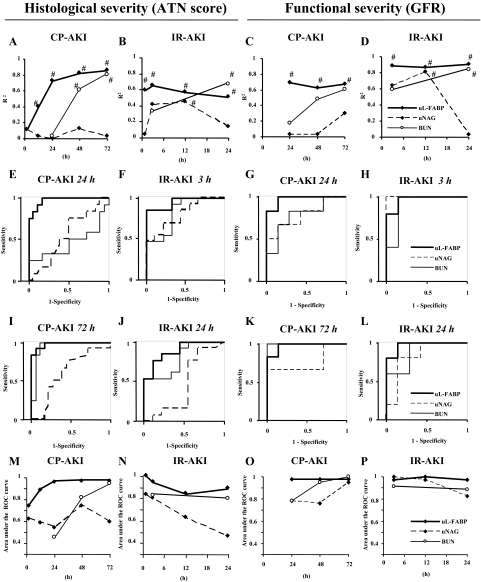
Figure 3.
Correlation of renal biomarkers with histological injury and functional decline in AKI. R2 values were calculated with the renal biomarkers at each time point and the ATN score at 72 hours in CP-AKI (A, n = 30) or 24 hours in IR-AKI (B, n = 22). R2 values were also calculated with the renal biomarkers at each time point and measured GFR at 72 hours in CP-AKI (C, n = 13) or at 24 hours in IR-AKI (D, n = 12). #P < 0.001. ROC curve analysis for detecting moderate to severe histological injuries in CP and IR AKI was performed with renal biomarkers at 24 hours (E) or 72 hours (I) after CP injection (n = 30) and 3 hours (F) or 24 hours (J) after IR (n = 22). The areas under the ROC curve were calculated with the renal biomarkers at each time point in CP-AKI (M, n = 30) and IR-AKI (N, n = 22). ROC curve analysis for detecting the functional change of GFR >25% decrease in CP- and IR-induced AKI was performed with renal biomarkers at 24 hours (G) or 72 hours (K) after CP injection (n = 13) and 3 hours (H) or 24 hours (L) after IR (n = 12). The areas under the ROC curve were calculated with the renal biomarkers at each time point in CP-AKI (O, n = 13) and IR-AKI (P, n = 12).

