Figure 1.
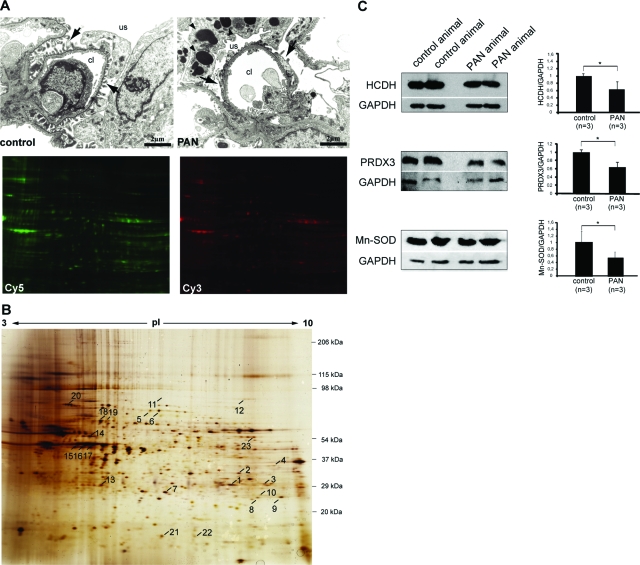
Proteomics study. A: Transmission electron micrographs showing a normal rat glomerular capillary (left) and a PAN glomerular capillary (right). Arrows indicate the podocyte foot processes and arrowheads mark the presence of large vacuoles in podocytes after PA administration. Proteins extracted from isolated normal control and PAN glomeruli were then labeled with Cy5 and Cy3, respectively, and further separated on one 2-D gel and detected by fluorescence scanning of the gel according to the appropriate wavelengths. B: Silver-stained 2-D pattern of extracted glomerular proteins separated on a pH range from 3 to 10 nonlinear in the first dimension. The second dimension was performed on a 3.6 to 15% self-made gradient SDS-PAA gel. The numbered protein spots were identified by vMALDI mass spectrometry. The identified proteins are listed in Table 1. C: Verification of the DIGE results by Western blot analysis using antibodies against HCDH, PRDX-3, and Mn-SOD. Total glomerular lysates from normal control and PAN animals were separated by 1-D SDS-PAGE and then transferred onto a nitrocellulose membrane. Representative Western blots are given in the left panels and the data presented in the right panels are means ± SD. The expression of GAPDH was used for normalization. The ratios in the control group were considered as 1. *P ≤ 0.05 with respect to control. Abbreviations: cl, capillary lumen; us, urinary space.

