Figure 3.
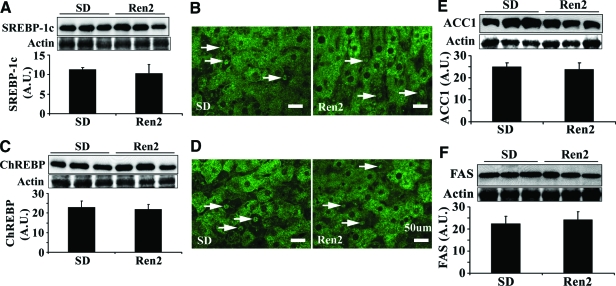
Hepatic lipogenic transcription factors and enzymes. A: Representative immunoblot for active SREBP-1c (68 kDa, top) and bar graph representing band densitometry (bottom). B: Representative immunofluorescence images showed that SREBP-1c was predominantly located in cytoplasm (green) and a few nuclei stained (arrows). C: Representative immunoblot for ChREBP (top) and bar graph representing band densitometry (bottom). D: Immunofluorescence staining for ChREBP. ChREBP was predominantly located in cytoplasm (green) and a few nuclei stained (arrows). E and F: Representative Western blot bands and densitometry analysis for ACC1 and FAS. The results of A, C, E, and F are mean ± SEM for five rats for each group, there were no significant differences between Ren2 versus SD controls (P > 0.05). No signal was obtained when liver sections were incubated with the secondary antibody only (data not shown). Scale bars = 50 μm. Original magnifications, ×400.

