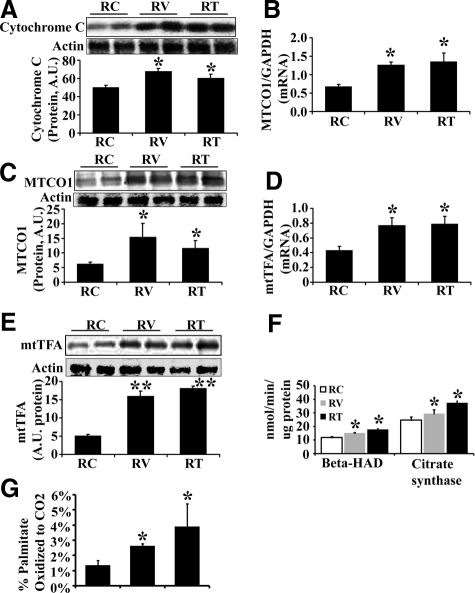
Figure 5.
Effects of valsartan and tempol on hepatic mitochondrial indices and β-oxidation. A: Representative Western blot for cytochrome c (top) and bar graph for densitometry analysis (bottom). B: MTCO1 mRNA expression (normalized to GAPDH). C: Representative Western blot for MTCO1 (top) and bar graph for densitometry analysis (bottom). D: mtTFA mRNA expression (normalized with GAPDH). E: Representative Western blot for mtTFA (top) and bar graph for densitometry analysis (bottom). F: Activity of β-HAD and citrate synthase. G: The percentage of palmitate oxidized completely to CO2. The results are mean ± SEM for five rats for each group, *P < 0.05 RV or RT versus RC. **P < 0.01 RV or RT versus RC.

