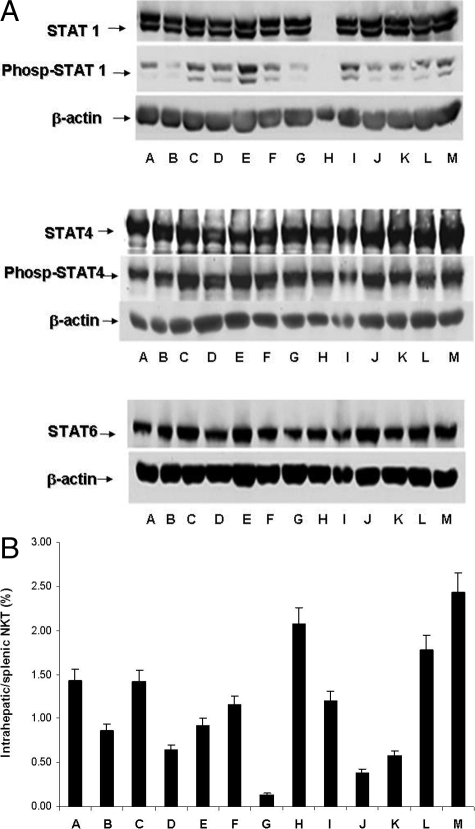
Figure 4.
A: Effects of different ratios and doses of β-ligands on phosphorylated STAT1, STAT4, and STAT6 levels in the mouse Con A hepatitis model. Treatments A–M are specified in Table 1. B: Effects of different ratios and doses of β-ligands on NKT lymphocyte distribution in the mouse Con A hepatitis model. FACS analysis was preformed for CD3/NK1.1 surface markers on lymphocytes in the spleen and in the liver.

