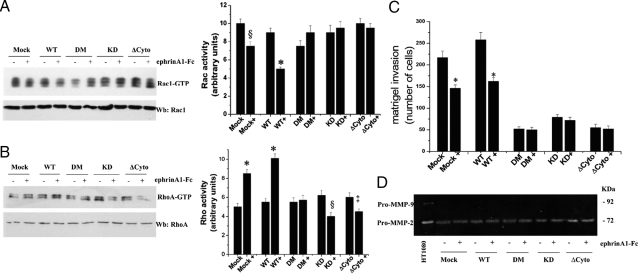
Figure 5.
Kinase-dependent and -independent role of EphA2 in ephrinA1-mediated motility response. A: PC3 cells, expressing wild-type (WT) EphA2 or kinase-deficient mutants, were serum-starved for 24 hours and then stimulated with either 1 μg/ml of ephrinA1-Fc or Fc for 15 minutes. Rac1-GTP was analyzed by a pull-down assay. The total amount of Rac-1 was then quantified by anti-Rac1 immunoblot and the bar graph obtained from densitometry analysis of triplicate experiments is shown. §P < 0.005 stimulated versus control; *P < 0.001 stimulated versus control. B: PC3 cells were treated as in A and a RhoA activity assay was performed. The total amount of RhoA was then quantified by anti-RhoA immunoblot and the bar graph obtained from densitometry analysis of triplicate experiments is shown. *P < 0.001 stimulated versus control; §P ≤ 0.005 stimulated versus control; ‡P ≤ 0.01 stimulated versus control. C: Boyden cell invasion assay. PC3 cells expressing wild-type EphA2 or kinase-deficient mutants, after 24 hours of serum starvation, were seeded into the upper chamber of Boyden chambers precoated with a Matrigel three-dimensional milieu. Cells were allowed to migrate for 24 hours toward the lower chamber filled with complete growth medium together with 1 μg/ml of ephrinA1-Fc. Cell invasion was evaluated after crystal violet staining by counting cells in six randomly chosen fields. The results are representative of four experiments. *P < 0.001 stimulated versus control. D: Analysis of MMP activity. PC3 cells expressing wild-type EphA2 or kinase-deficient mutants, were serum-deprived for 24 hours and then stimulated with 1 μg/ml of ephrinA1-Fc. After 24 hours the growth medium was collected and analyzed by gelatin zymography. The clear bands represent areas of gelatinase activity. The results are representative of four experiments.

