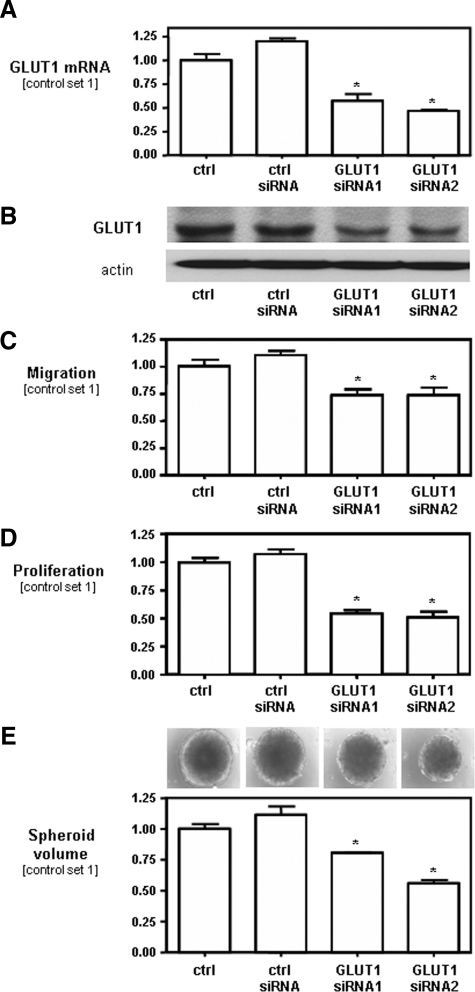
Figure 3.
Effect of GLUT1 inhibition on migration and proliferation of HCC cells. Analysis of GLUT1 (A) mRNA and (B) protein expression in Hep3B cells transiently transfected with two different GLUT1 siRNAs (siRNA1 and siRNA2), and cells transfected with control siRNA and nontransfected HCC cells (ctrl.). C: The migratory potential of these cells was assessed by Boyden chamber assays. D: For analysis of proliferation, cells were trypsinized and counted at different time points. Cell number at day 4 is set at 1. E: Growth in a three-dimensional cell culture system was assessed by analysis of the spheroid volume at day 14. All experiments have been performed at least three times. Data are given as mean ± SEM (*P < 0.05 compared with controls).

