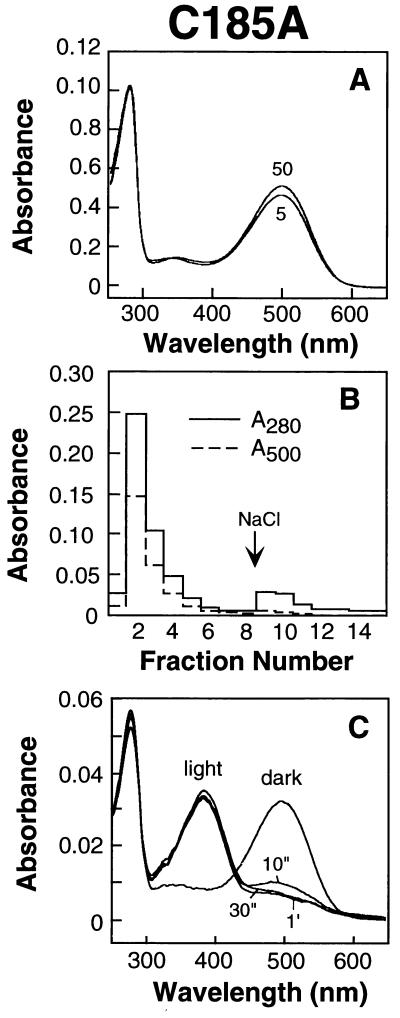
Figure 3.
Characterization of the mutant rhodopsin C185A. (A) UV–vis spectra of the rhodopsin isolated after treatment of COS-1 cells expressing the opsin mutant in vivo with 5 and 50 μM retinal. Elution from the 1D4-Sepharose column was with Buffer A containing 0.05% DM plus 100 μM peptide. (B) Elution profile from 1D4-Sepharose of the mutant rhodopsin obtained as in A, first with Buffer J (no salt) (first eight fractions) followed by elution with Buffer K (containing salt). Shown are the A280 and A500 profiles of the eluted fractions. (C) Bleaching behavior of the second fraction (B). The dark UV–vis spectrum shown had an A280/A500 ratio of 1.7.

