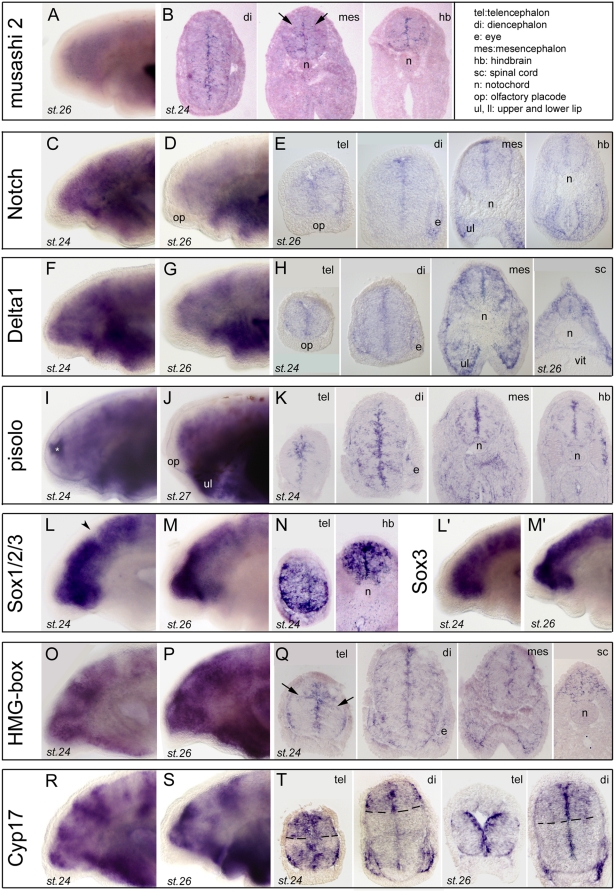
Figure 2. Expression of stem cell and proliferation markers in lamprey developing brain.
A (toto) and B (sections) show lamprey musashi 2 (Msi2, clone 40). C,D (toto) and E (sections) show lamprey Notch (clone 49). F,G (toto) and H (sections) show lamprey Delta1 (clone 48). Vit, vitellus. I,J (toto) and K (sections) show lamprey pisolo (pictures taken from clone 169). The white asterisk in panel I indicates background trapping in the ventricle. L,M (toto) and N (sections) show a lamprey SoxB1 (Sox1/2/3) member, see also phylogeny for Sox genes in Figure S5). Toto views are from clone 38, and sections from clone 42. L',M' (toto) show another SoxB1 member identified as Sox3 (pictures taken from clone 137). O,P (toto) and Q (sections) show a lamprey HMG-box (toto view from clone 148, sections from clone 147). Arrows in panel 2Q indicate putative streams of radially migrating cells. R,S (toto) and T (sections) show lamprey Cyp17 (toto views are from clones 154 and 153, sections are from clone 152). Dotted lines in T highlight the “banded” pattern of expression of this transcript. The inset in the upper right corner gives the list of anatomical abbreviations used in this and other figures.

