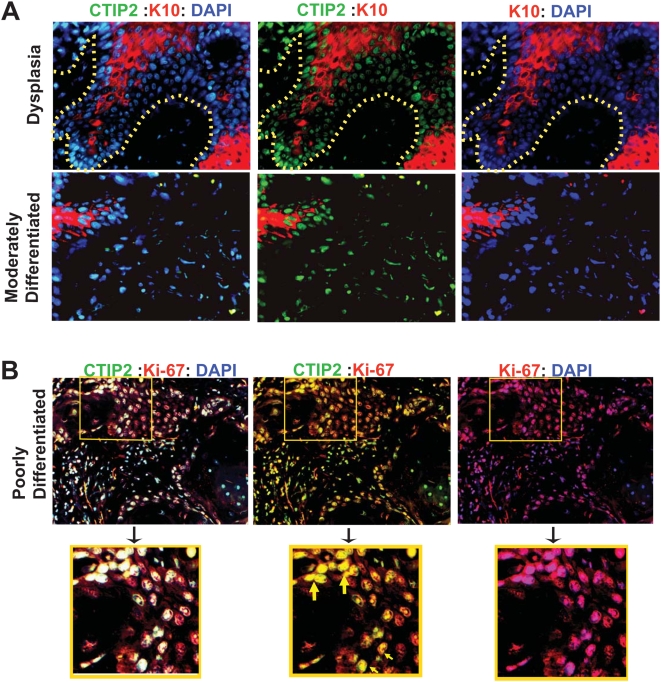
Figure 3. Co-staining of CTIP2, cytokeratin 10 and Ki-67 using immunofluorescence.
(A) Co-staining of CTIP2 and differentiation marker cytokeratin 10 in dysplasia and in moderately differentiated tumor. CTIP2 in green, Cytokeratin 10 in red and DAPI in blue. Yellow dotted lines represents the margin of epidermis and dermis. (B) Co-staining of CTIP2 and a proliferation marker Ki-67 in poorly differentiated tumor. Insets are in yellow boxes and are magnified. Yellow arrows shows the CTIP2-Ki-67 double positive cells. (Original Magnification: 20×).

