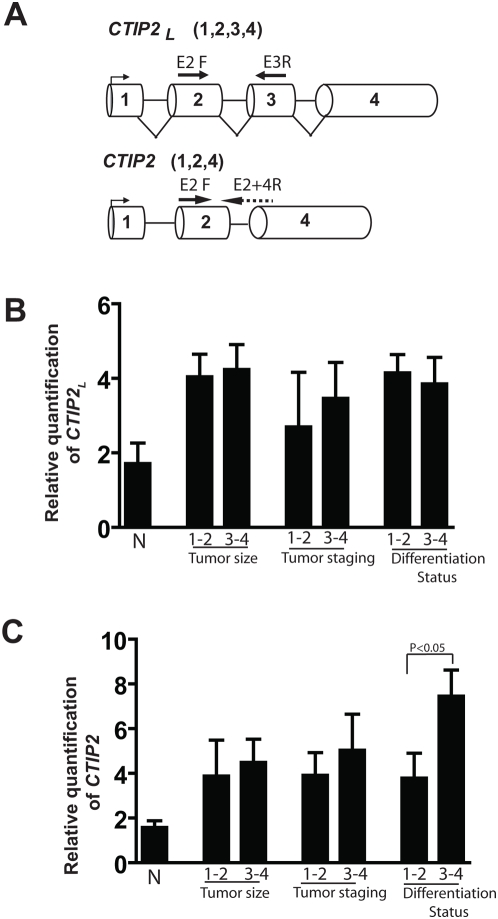
Figure 4. Scheme of CTIP2 transcripts and the expression pattern of CTIP2L and CTIP2 in HNSCC.
(A) Two transcripts of human CTIP2 are shown. CTIP2 with all the 4 exons, is the long form of CTIP2 (CTIP2 L), and, lacking exon 3 is the actual CTIP2. Primers for the long form were taken from Exon 2 for Forward and exon 3 for reverse, and for the shorter form, the forward from boundary of Exon 2 & 4 and the reverse from exon 4. Expression of the CTIP2 long (B) and CTIP2 (C), by qRT-PCR in HNSCC (n = 28) and 10 normal uvulas based on T size, Tumor staging, and differentiation status. Plotted are the Relative quantification levels normalized with RPLPO as S.E.M±. p values were not significant between the groups in (B) but a significant correlation of higher CTIP2 expression was observed with a poorer histological grade of the tumor, and a trend was noted in a relationship between expression and advanced T or clinical stage in (C) [P<0.05].

