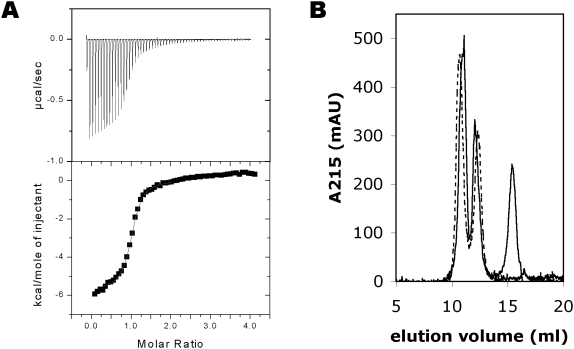
Figure 2. Characterization of the complex by calorimetry and size exclusion chromatography.
A. ITC. Top; the original titration curve, bottom; the integrated peak areas were used in curve fitting. B. Size exclusion chromatography of CaM in the absence (dashed line) and presence (solid line) of the CnA-CBD peptide. Note the shift of the first peak (CaM) towards a larger elution volume in the presence of the peptide. The second peak is a form of CaM appearing in CaM samples upon storage, possibly a permanently collapsed form (data not shown). The third peak is the peptide. A(215) is shown in order to visualize the location of the peptide, which does not absorb at 280 nm. The presence of the peptide in the first and third peaks was confirmed by SDS-PAGE (Figure S1).

