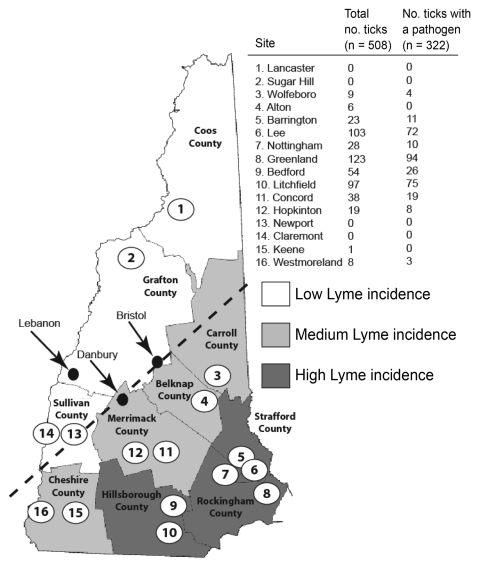
Figure 1.
Results of Ixodes scapularis tick sampling and pathogen screening in New Hampshire. County names are shown in bold and sampling sites across counties of low (white), medium (light gray), and high (dark gray) Lyme disease incidence are numbered. Dashed line indicates the leading edge of the expanding I. scapularis range. Arrows and black dots indicate cities referred to in the discussion. Numbered open circles identify the locations of the 16 sample sites.

